The RAMMS::Extended model contains two pressure modules: one for the avalanche core and one for the powder cloud.
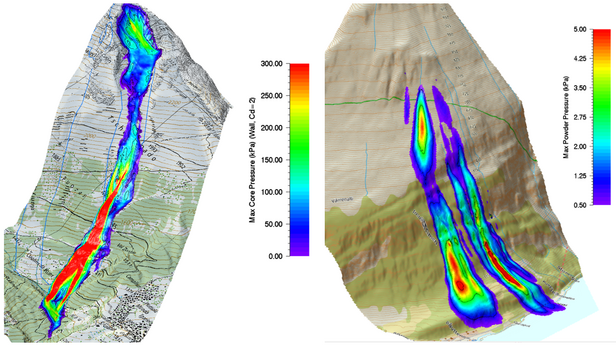
It is possible to display the calculated maximum impact pressures for the core and the cloud in three-dimensional terrain, superimposed on maps or ortho-photos. This allows the user to visualize the spatial extent of the pressure (Fig. 1). They provide a measure of cloud pressures after the core has stopped, but also the pressures on the lateral edges of the avalanche cloud.
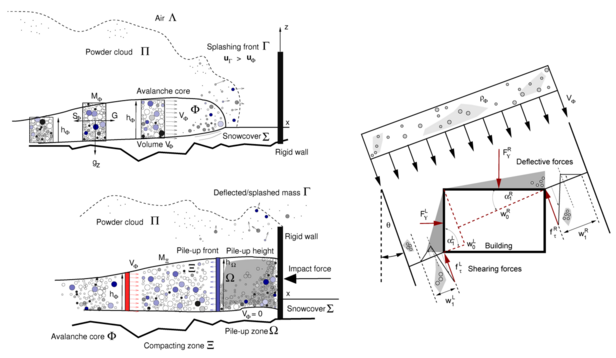
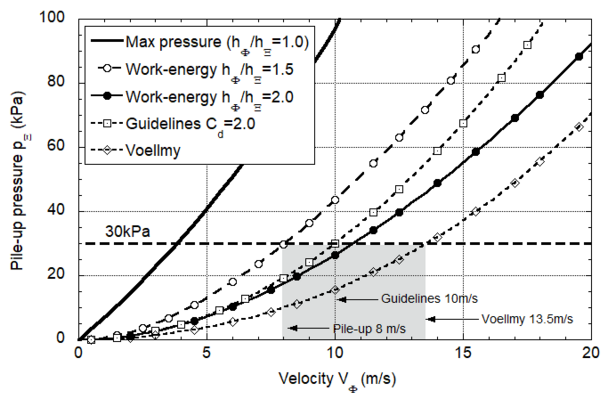
At impact, the avalanche core can exert stagnation forces (pile-up forces), deflective forces and/or shearing tractions (and combinations) on an obstacle. The force depends on the avalanche speed and flow composition (height and density), but also on the geometry of the structure relative to the angle of attack (Fig. 2). In the RAMMS::Extended model we have introduced different calculation methods to allow engineers to study different loading scenarios. For example, to calculate the forces of stagnation on wide obstacles, such as walls, it is possible to apply guideline (Cd=2), work-energy methods, or even the original Voellmy model. To use the work-energy method the engineer must assume a kinematically possible impact configuration at the end of the interaction. For example, the engineer must assume a pile-up height, and the end density of the piled-up avalanche snow. The model results can be compared to the guideline procedures (it is indeed possible to have Cd>2 under certain kinematic assumptions). The Voellmy model is also useful since it assumes the compacted density at pile-up is a function of the approach velocity, and the pile-up height is given by energy considerations (Fig. 3).

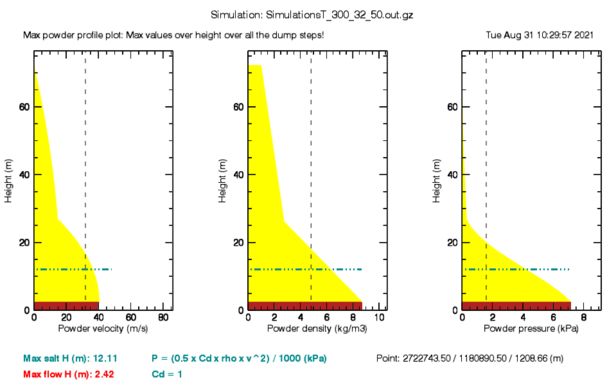
The model of the avalanche cloud predicts mean flow densities and velocities. As shown above, these values are used to construct maximum cloud pressure maps (Fig. 1). However, it is often necessary to have information regarding the distribution of pressure over the height of the powder cloud. In RAMMS::Extended, the mean values are then used to construct density and velocity profiles over the calculated height of the powder cloud (Fig. 4). These pressure profiles provide an idea of the difference between the mean and possible maximum pressures in the flow.


